import numpy as np
import pandas as pd
import scipy.cluster as cluster
import scipy.stats as stats
import seaborn as sns
import statsmodels.formula.apiAppendix J — Practice Problem Solutions — Chapter 8
The solutions use the following imports:
Solution Section 8.7.1
np.random.seed(2503478)
group_A = stats.norm(loc=10, scale=2).rvs(30)
group_B = stats.norm(loc=15, scale=2).rvs(30)
result = stats.ttest_ind(group_A, group_B)
print(result)
TtestResult(statistic=np.float64(-8.473531241332175), pvalue=np.float64(9.899983754486164e-12), df=np.float64(58.0))Solution Section 8.7.2
np.random.seed(493567)
group_A = stats.norm(loc=10, scale=2).rvs(30)
group_B = stats.norm(loc=15, scale=2).rvs(30)
group_C = stats.norm(loc=11, scale=2).rvs(30)
result = stats.f_oneway(group_A, group_B, group_C)
print(result)
F_onewayResult(statistic=np.float64(56.614548038664914), pvalue=np.float64(1.7891834179400852e-16))Solution Section 8.7.3
result = stats.tukey_hsd(group_A, group_B, group_C)
print(result)
Tukey's HSD Pairwise Group Comparisons (95.0% Confidence Interval)
Comparison Statistic p-value Lower CI Upper CI
(0 - 1) -4.656 0.000 -5.787 -3.525
(0 - 2) -0.643 0.369 -1.774 0.488
(1 - 0) 4.656 0.000 3.525 5.787
(1 - 2) 4.013 0.000 2.882 5.144
(2 - 0) 0.643 0.369 -0.488 1.774
(2 - 1) -4.013 0.000 -5.144 -2.882
Solution Section 8.7.4
np.random.seed(932847)
x1 = np.random.uniform(-10, 10, 50)
x2 = np.random.uniform(-10, 10, 50)
y = 3 * x1 + np.random.normal(0, 2, 50)
df = pd.DataFrame({"X1": x1, "X2": x2, "Y": y})
model = statsmodels.formula.api.ols("Y ~ X1 + X2", data=df).fit()
print(model.summary().tables[1])
==============================================================================
coef std err t P>|t| [0.025 0.975]
------------------------------------------------------------------------------
Intercept -0.4118 0.295 -1.395 0.170 -1.006 0.182
X1 3.0064 0.046 65.950 0.000 2.915 3.098
X2 -0.0319 0.053 -0.606 0.547 -0.138 0.074
==============================================================================Solution Section 8.7.5
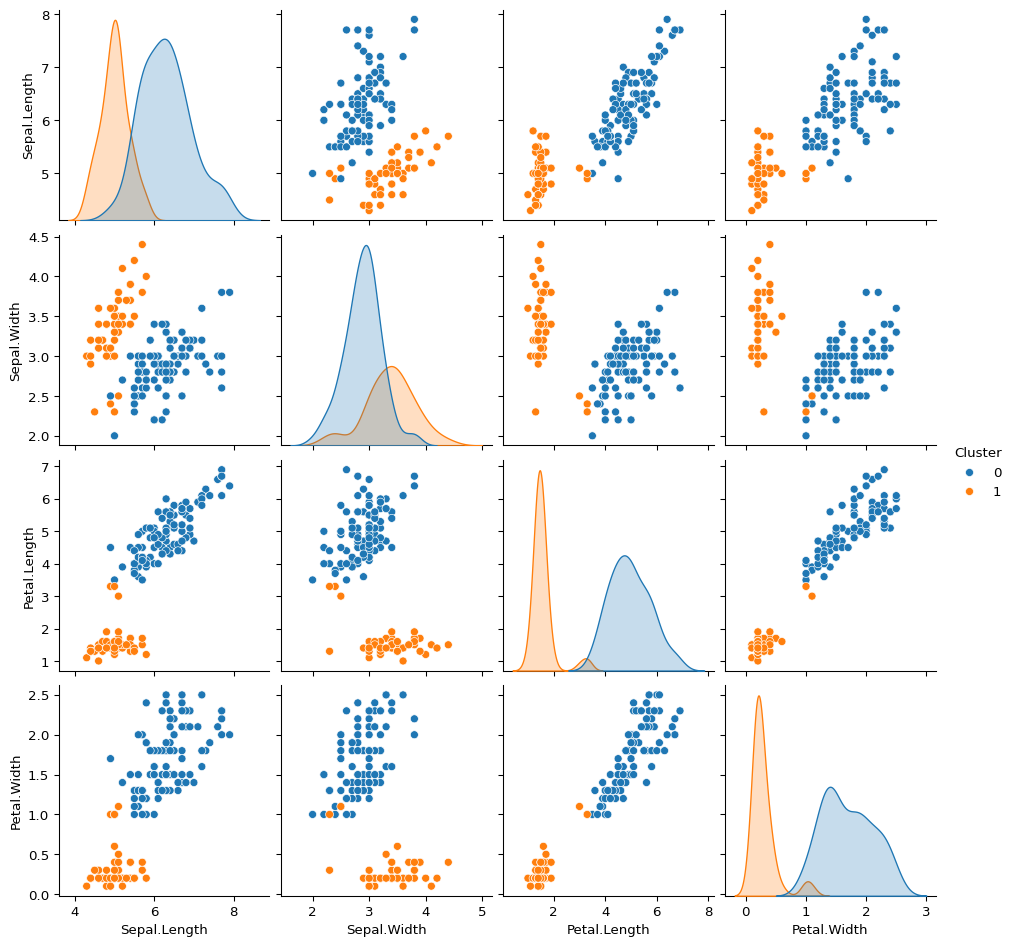
Two clusters mainly separate setosa from versicolor and virginica, which makes biological sense given that setosa is the most distinct species.
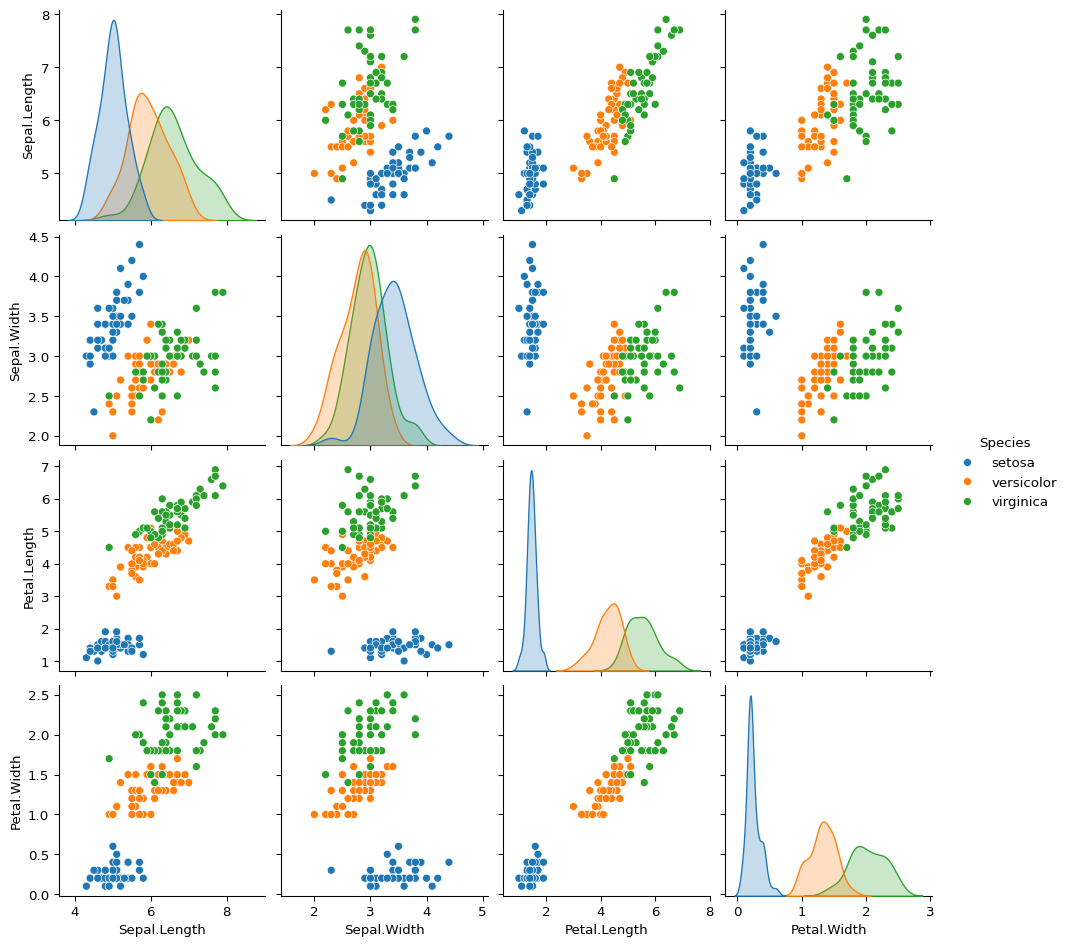
iris = pd.read_csv("../../_data/iris.csv")
sns.pairplot(iris, hue="Species")
_centroids, labels = cluster.vq.kmeans2(iris.drop(columns="Species"), k=2)
sns.pairplot(iris.assign(Cluster=labels), hue="Cluster")